Can LLMs play The Price is Right?
Can LLMs play The Price is Right?
July 23, 2025
By Allen Downey
Synthetic consumers—LLMs simulating human survey participants—are becoming a powerful tool for marketing and behavioral research. They promise faster iteration, lower costs, and broader flexibility than traditional panels. But for them to be useful, they need not only to sound realistic, but also to demonstrate some level of real-world reasoning.
A core question in this space: do LLMs “understand” prices? That is, can they recognize how much everyday items cost, and make decisions based on that understanding?
To explore this, we built a synthetic version of the Showcase game from The Price is Right, a game show where contestants try to estimate the value of consumer products. The result is a lightweight but surprisingly informative benchmark: a test of both knowledge and reasoning under constraints.
The Showcase Experiment
In the TV version of The Price is Right, contestants bid on lavish collections of prizes—cars, appliances, and tropical vacations. In our version, the prizes are more mundane: consumer packaged goods (CPGs) like toothpaste, snack bars, and household cleaners. Instead of $30,000 showrooms, the total value is usually around $20.
The rules are simple:
-
Two LLMs (contestants) see the same showcase of items.
-
They each bid on the total value of the showcase.
-
The closest bid without going over wins.
-
If both overbid, neither wins.
We use this setup to probe several model abilities:
-
Estimating real-world prices of common goods.
-
Using reference examples to calibrate those estimates.
-
Strategically adjusting estimates to avoid disqualification.
How It Works
Each “round” of the tournament follows this format:
-
Generate a random showcase of three CPG items from our dataset.
-
Provide 10 example prices from similar products to calibrate the models.
-
Send the same prompt to two models, including the showcase and example prices.
-
Parse the bid and rationale, enforcing strict formatting and short responses.
-
Compare bids to the actual retail price, determine the winner, and update metrics.
Here's what the prompt looks like (excerpted):
You are a contestant on The Price is Right.
GOAL: Bid as close as possible to the total retail price WITHOUT GOING OVER. CRITICAL RULE: If your bid is over the actual price, you lose. GOAL: Bid as close as possible to the total retail price WITHOUT GOING OVER. CRITICAL RULE: If your bid is over the actual price, you lose. Showcase Items:
{showcase.description} Example Prices:
{showcase.example_prices} CRITICAL: You must respond with ONLY a single JSON object in this format:
{"bid": 1234.56, "rationale": "Brief explanation..."}
Including the format in the prompt discourages verbose outputs and facilitates parsing – even though not all models follow the instructions.
Contestants and Rounds
We started with a broad field of 90 models—everything from foundation models to smaller instruction-tuned variants. We ran two preliminary rounds to eliminate models that were clearly not in the running, and to refine our prompt to elicit better responses. During each round, every model saw the same 20 showcases, and we computed the mean absolute percentage error (MAPE) of their bids, ignoring overbidding. In the first round, most versions of Gemini Flash were eliminated, along with several versions of Llama and DeekSeek R1. In the second round, we lost more of the same, and a few GPT minis. The top 50 models (lowest MAPE) moved on to the finals.
In the finals, we ran 50 showcases. For each showcase, we
- Paired the contestants at random,
- Solicited bids from each pair, and
- Recorded the bids, whether or not the contestants overbid, and who won.
Metrics
We evaluate the models along several dimensions:
- Mean Absolute Percentage Error (MAPE)
Measures how close each bid was to the actual price, ignoring overbids. Lower is better. - Overbid rate
The percentage of bids that exceed the actual price—resulting in automatic loss. A high overbid rate suggests poor calibration or lack of strategic conservatism. - Win rate and Elo rating
Tracks direct wins and losses across matchups using an Elo rating system. A model that consistently outbids (without overbidding) its peers rises in the rankings.
These metrics reflect both accuracy and adaptiveness—some models may have low MAPE but lose frequently due to risky bidding.
Results
Some models are surprisingly accurate, and some are much worse
Here are the top 10 models by MAPE:
| Rank | Model | Rating | # wins | MAPE | Overbid % |
|---|---|---|---|---|---|
| 1 | o3 | 1025.8 | 22 | 13.5 | 42.0 |
| 2 | o1-2024-12-17 | 1220.1 | 22 | 14.6 | 44.0 |
| 3 | o3-2025-04-16 | 922.1 | 18 | 14.6 | 44.0 |
| 4 | o1 | 1092.2 | 21 | 14.9 | 42.0 |
| 5 | gpt-4.1 | 1285.2 | 29 | 17.9 | 22.0 |
| 6 | o1-preview-2024-09-12 | 889.0 | 17 | 18.7 | 46.0 |
| 7 | gpt-4.1-2025-04-14 | 1103.0 | 24 | 18.7 | 24.0 |
| 8 | o3-mini | 1070.7 | 21 | 19.4 | 38.0 |
| 9 | gpt-4.5-preview | 1072.4 | 23 | 20.3 | 28.0 |
| 10 | o1-preview | 1147.5 | 23 | 20.6 | 51.0 |
| 11 | o3-mini-2025-01-31 | 1003.9 | 23 | 20.6 | 30.0 |
| 12 | claude-3-5-sonnet-20241022 | 1058.9 | 21 | 20.7 | 42.0 |
| 13 | gpt-4o | 1303.9 | 29 | 21.1 | 22.0 |
| 14 | claude-3-7-sonnet-20250219 | 1021.6 | 20 | 21.1 | 50.0 |
| 15 | gpt-4 | 1101.6 | 24 | 21.3 | 28.0 |
| 16 | gpt-4o-2024-05-13 | 1164.7 | 28 | 22.1 | 20.0 |
| 17 | gpt-4-0613 | 1126.6 | 23 | 22.2 | 36.0 |
| 18 | gpt-4o-2024-08-06 | 992.3 | 20 | 22.3 | 30.0 |
| 19 | o4-mini | 892.4 | 16 | 22.9 | 54.0 |
| 20 | claude-opus-4-20250514 | 719.9 | 14 | 23.4 | 32.0 |
| 21 | o4-mini-2025-04-16 | 960.3 | 16 | 23.4 | 60.0 |
| 22 | gpt-4.5-preview-2025-02-27 | 1113.6 | 23 | 23.6 | 20.0 |
| 23 | claude-3-5-sonnet-20240620 | 949.8 | 19 | 24.0 | 46.0 |
| 24 | claude-sonnet-4-20250514 | 1012.2 | 21 | 24.1 | 34.0 |
| 25 | qwen2-vl-72b-instruct | 803.4 | 16 | 25.0 | 38.0 |
| 26 | gpt-4o-search-preview-2025-03-11 | 876.8 | 16 | 25.6 | 54.0 |
| 27 | chatgpt-4o-latest | 1209.6 | 31 | 25.9 | 2.0 |
| 28 | gpt-4o-search-preview | 1154.4 | 26 | 25.9 | 36.0 |
| 29 | llama-v3p3-70b-instruct | 1068.7 | 21 | 26.7 | 42.0 |
| 30 | gpt-4o-2024-11-20 | 1151.3 | 27 | 26.8 | 12.0 |
| 31 | llama-3.3-70b-versatile | 1071.6 | 21 | 27.1 | 40.0 |
| 32 | gpt-3.5-turbo-1106 | 1156.3 | 26 | 27.3 | 28.0 |
| 33 | llama3-70b-8192 | 949.6 | 20 | 27.4 | 38.0 |
| 34 | gemini-1.5-pro | 1072.8 | 21 | 27.6 | 34.0 |
| 35 | llama-v3p1-405b-instruct | 860.0 | 16 | 27.7 | 44.0 |
| 36 | claude-3-opus-20240229 | 930.0 | 20 | 28.5 | 16.0 |
| 37 | gemini-1.5-pro-002 | 1025.1 | 21 | 29.1 | 32.0 |
| 38 | gpt-4.1-mini-2025-04-14 | 985.1 | 21 | 30.9 | 22.0 |
| 39 | compound-beta | 874.4 | 16 | 31.0 | 43.8 |
| 40 | gemini-1.5-flash-8b-001 | 962.4 | 19 | 31.2 | 42.0 |
| 41 | gemini-1.5-flash-8b | 935.0 | 15 | 31.7 | 48.0 |
| 42 | qwen3-30b-a3b | 844.8 | 17 | 31.9 | 20.0 |
| 43 | gpt-4-turbo | 858.4 | 14 | 32.2 | 68.0 |
| 44 | gpt-4-turbo-2024-04-09 | 696.6 | 11 | 32.7 | 72.0 |
| 45 | gpt-3.5-turbo | 884.3 | 19 | 34.7 | 12.0 |
| 46 | gpt-3.5-turbo-16k | 993.9 | 23 | 34.9 | 14.0 |
| 47 | gpt-3.5-turbo-0125 | 897.2 | 20 | 35.9 | 10.0 |
| 48 | o1-mini | 981.3 | 15 | 39.6 | 56.0 |
| 49 | qwen-qwq-32b | 815.4 | 16 | 41.1 | 38.0 |
| 50 | llama4-scout-instruct-basic | 692.0 | 10 | 53.1 | 70.0 |
The lowest mean absolute percentage error (MAPE) is 14%, which is better than the performance of human contestants on the show, about 18% (see Chapter 9 of Think Bayes). The highest MAPE is 53%, barely better than guessing without looking at the showcase.
The following scatterplot shows the actual values of the showcases and the bids from the best and worst model.
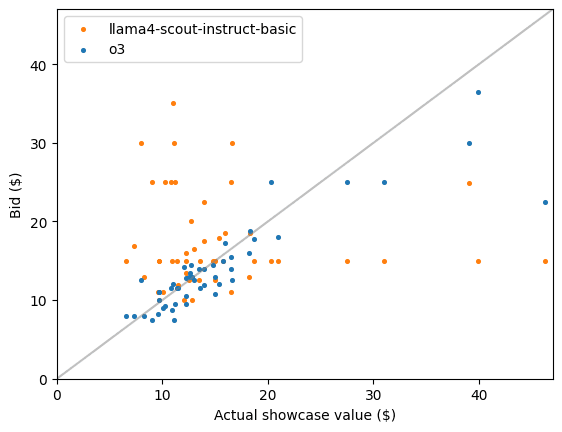
The bids from OpenAI o3 track the actual values closely, with only one notable miss on the highest-valued showcase. The correlation of bids and actual values is 0.89. In contrast, the bids from Llama4 are unrelated to the actual values – the correlation is effectively 0.
Some models are more strategic than others
In the previous plot, it looks like o3 is bidding strategically — more bids are below the actual value than above (58%). But some models are substantially better at avoiding overbidding. The most conservative model overbids only 2% of the time. The most aggressive model overbids 72% of the time. For comparison, contestants on the show overbid about 25% of the time.
The following scatter plot shows what the bid patterns look like for the models with the highest and lowest overbid percentages:
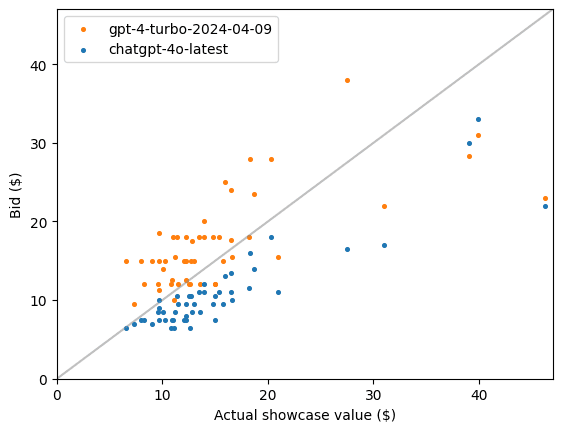
For both models the bids are well correlated with the actual values (0.69 and 0.90) but in one case they are consistently high and in the other case consistently low.
Winning is a combination of accuracy and strategy
Here are the top models sorted by Elo rating:
| Rank | Model | Rating | # wins | MAPE | Overbid % |
|---|---|---|---|---|---|
| 1 | gpt-4o | 1303.9 | 29 | 21.1 | 22.0 |
| 2 | gpt-4.1 | 1285.2 | 29 | 17.9 | 22.0 |
| 3 | o1-2024-12-17 | 1220.1 | 22 | 14.6 | 44.0 |
| 4 | chatgpt-4o-latest | 1209.6 | 31 | 25.9 | 2.0 |
| 5 | gpt-4o-2024-05-13 | 1164.7 | 28 | 22.1 | 20.0 |
| 6 | gpt-3.5-turbo-1106 | 1156.3 | 26 | 27.3 | 28.0 |
| 7 | gpt-4o-search-preview | 1154.4 | 26 | 25.9 | 36.0 |
| 8 | gpt-4o-2024-11-20 | 1151.3 | 27 | 26.8 | 12.0 |
| 9 | o1-preview | 1147.5 | 23 | 20.6 | 51.0 |
| 10 | gpt-4-0613 | 1126.6 | 23 | 22.2 | 36.0 |
| 11 | gpt-4.5-preview-2025-02-27 | 1113.6 | 23 | 23.6 | 20.0 |
| 12 | gpt-4.1-2025-04-14 | 1103.0 | 24 | 18.7 | 24.0 |
| 13 | gpt-4 | 1101.6 | 24 | 21.3 | 28.0 |
| 14 | o1 | 1092.2 | 21 | 14.9 | 42.0 |
| 15 | gemini-1.5-pro | 1072.8 | 21 | 27.6 | 34.0 |
| 16 | gpt-4.5-preview | 1072.4 | 23 | 20.3 | 28.0 |
| 17 | llama-3.3-70b-versatile | 1071.6 | 21 | 27.1 | 40.0 |
| 18 | o3-mini | 1070.7 | 21 | 19.4 | 38.0 |
| 19 | llama-v3p3-70b-instruct | 1068.7 | 21 | 26.7 | 42.0 |
| 20 | claude-3-5-sonnet-20241022 | 1058.9 | 21 | 20.7 | 42.0 |
| 21 | o3 | 1025.8 | 22 | 13.5 | 42.0 |
| 22 | gemini-1.5-pro-002 | 1025.1 | 21 | 29.1 | 32.0 |
| 23 | claude-3-7-sonnet-20250219 | 1021.6 | 20 | 21.1 | 50.0 |
| 24 | claude-sonnet-4-20250514 | 1012.2 | 21 | 24.1 | 34.0 |
| 25 | o3-mini-2025-01-31 | 1003.9 | 23 | 20.6 | 30.0 |
| 26 | gpt-3.5-turbo-16k | 993.9 | 23 | 34.9 | 14.0 |
| 27 | gpt-4o-2024-08-06 | 992.3 | 20 | 22.3 | 30.0 |
| 28 | gpt-4.1-mini-2025-04-14 | 985.1 | 21 | 30.9 | 22.0 |
| 29 | o1-mini | 981.3 | 15 | 39.6 | 56.0 |
| 30 | gemini-1.5-flash-8b-001 | 962.4 | 19 | 31.2 | 42.0 |
| 31 | o4-mini-2025-04-16 | 960.3 | 16 | 23.4 | 60.0 |
| 32 | claude-3-5-sonnet-20240620 | 949.8 | 19 | 24.0 | 46.0 |
| 33 | llama3-70b-8192 | 949.6 | 20 | 27.4 | 38.0 |
| 34 | gemini-1.5-flash-8b | 935.0 | 15 | 31.7 | 48.0 |
| 35 | claude-3-opus-20240229 | 930.0 | 20 | 28.5 | 16.0 |
| 36 | o3-2025-04-16 | 922.1 | 18 | 14.6 | 44.0 |
| 37 | gpt-3.5-turbo-0125 | 897.2 | 20 | 35.9 | 10.0 |
| 38 | o4-mini | 892.4 | 16 | 22.9 | 54.0 |
| 39 | o1-preview-2024-09-12 | 889.0 | 17 | 18.7 | 46.0 |
| 40 | gpt-3.5-turbo | 884.3 | 19 | 34.7 | 12.0 |
| 41 | gpt-4o-search-preview-2025-03-11 | 876.8 | 16 | 25.6 | 54.0 |
| 42 | compound-beta | 874.4 | 16 | 31.0 | 43.8 |
| 43 | llama-v3p1-405b-instruct | 860.0 | 16 | 27.7 | 44.0 |
| 44 | gpt-4-turbo | 858.4 | 14 | 32.2 | 68.0 |
| 45 | qwen3-30b-a3b | 844.8 | 17 | 31.9 | 20.0 |
| 46 | qwen-qwq-32b | 815.4 | 16 | 41.1 | 38.0 |
| 47 | qwen2-vl-72b-instruct | 803.4 | 16 | 25.0 | 38.0 |
| 48 | claude-opus-4-20250514 | 719.9 | 14 | 23.4 | 32.0 |
| 49 | gpt-4-turbo-2024-04-09 | 696.6 | 11 | 32.7 | 72.0 |
| 50 | llama4-scout-instruct-basic | 692.0 | 10 | 53.1 | 70.0 |
The models with the most wins and the highest rankings are the ones that balance accuracy and strategy. OpenAI o3, which has the lowest MAPE, is ranked only #21 out of 50 because it overbids too often. Most top models have MAPE near 20% and overbid percentages less than 30% – although there are a few top performers that deviate from this strategy.
The top models are substantially better than the worst. In the Elo model, we expect the best model, with rating 1210, to beat the worst, with rating 845, about 90% of the time.
OpenAI dominates the top of the leaderboard
OpenAI models took the top 14 spots, and 16 of the top 20. Granted, part of this success is that they started with the most models (42 out of 90). And a few of them ended up near the bottom as well. But at least part of their success is earned – out of 42 models, 31 made it through the preliminary rounds.
The scatterplot below shows MAPE and overbid percentages for all 50 models, with each point colored by the backend used to access the model. OpenAI provides GPT-series models and related variants. Anthropic develops and hosts the Claude family of models. The Gemini backend provides Google’s Gemini models. Groq hosts high-speed inference for open or licensed models from other developers, including Meta’s LLaMA, Mistral, and Qwen. Similarly, Fireworks provides open-source or community-developed models including some from Meta, Mistral, and DeepSeek.
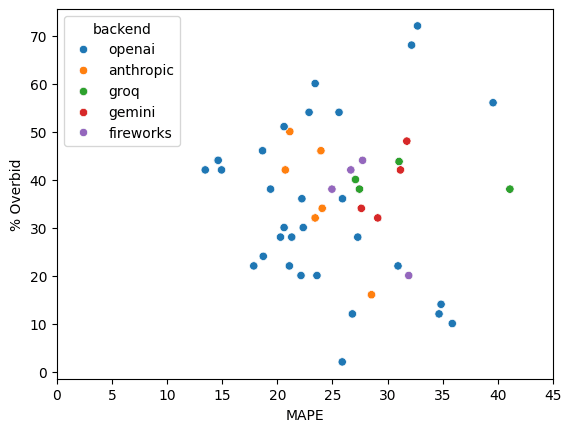
The best models are in the lower-left corner, with low MAPE and low overbid percentages. And we can see that this corner is populated entirely with OpenAI models. However, of the models that made it to the finals, the worst are also from OpenAI.
Why This Matters
Although this benchmark is light-hearted, it reflects a serious capability: using background knowledge and context to make constrained real-world decisions. This kind of reasoning underpins tasks like:
- Estimating costs in consumer surveys
- Recommending products within budgets
- Simulating realistic user behavior in test environments
By turning a game into a benchmark, we get a structured, repeatable way to measure models' real-world sensibility—not just their ability to talk about it.
Related articles:
- Synthetic Consumers: The Promise, The Reality, and The Future
- How Realistic Are Synthetic Consumers?
- Can Synthetic Consumers Answer Open-Ended Questions?
- Curious how GenAI powers the future of Bayesian MMM and consumer testing? → Watch our talk
Work with PyMC Labs
If you are interested in seeing what we at PyMC Labs can do for you, then please email info@pymc-labs.com. We work with companies at a variety of scales and with varying levels of existing modeling capacity. We also run corporate workshop training events and can provide sessions ranging from introduction to Bayes to more advanced topics.